Hello, community! I am a researcher with a strong interest in the APP protein (chromosome = ‘chr21’, start = 25880534, end = 26171128, strand = ‘-’, name = ‘APP’).
According to the prior studies I am referencing, the -369C>G, -534G>A, and -118C>A variants of APP are known to increase APP protein expression (doi:10.1093/brain/awl212, Am. J. Hum. Genet. 2006;78:936–946). Although these findings are based on luciferase reporter assays rather than analyses of the entire sequence as in alphagenome, I assumed that clinically, since these variants do increase APP levels, alphagenome should also show significant increases in expression.
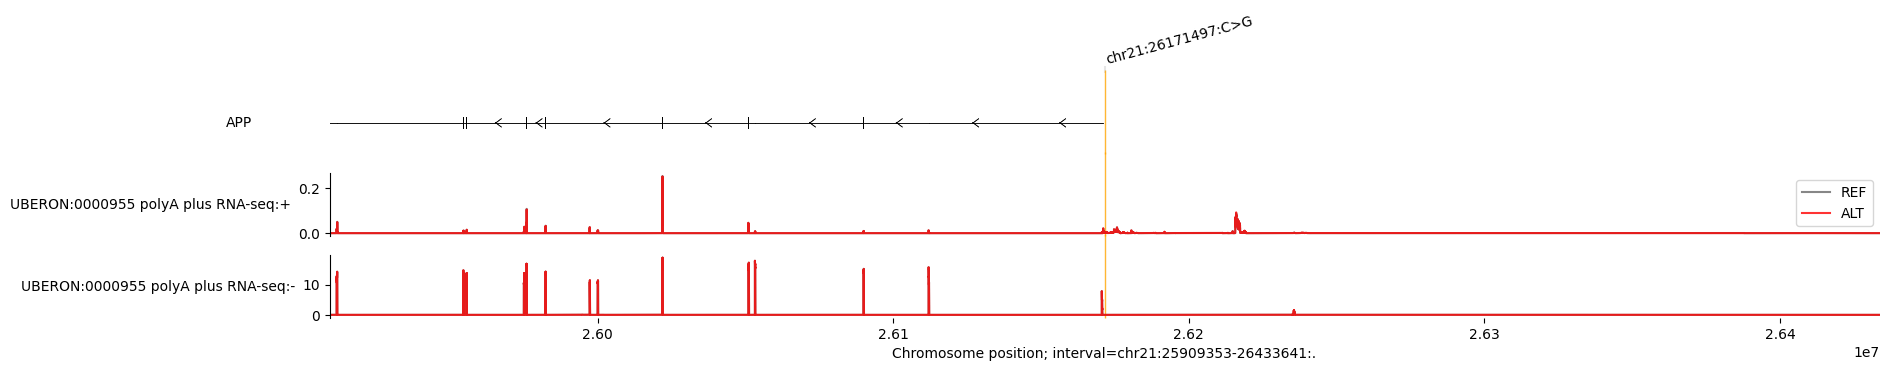
Since APP is on the negative strand, I tested the -369 position as 26171497, and the results of expression comparison and scoring are shown below. The GeneMaskActiveScorer shows a high quantile_score, but according to the GeneMaskLFCScorer, there is almost no observable difference between REF and ALT.

How should I interpret these results?
Additionally, when using GeneMaskLFCScorer, I find that variants with GeneMaskLFCScorer values around 0.1 are difficult to visualize as distinct expression differences in the APP protein. Do you have any tips for effective visualization in such cases?