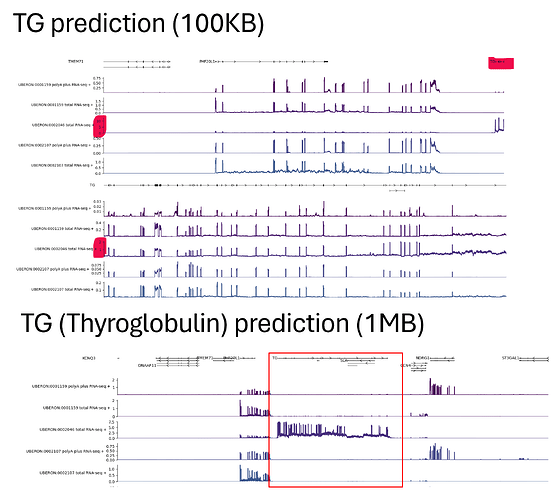
Hi everyone,
I am trying to test-run and understand alphagenome prediction with the TG in different tissue context and different sizes of intervals (a gene selectively expressed in the thyroid gland). I have found some discrepancy in the predictions where my cumulative 1KB interval predictions across that 1MB interval result in a different prediction value than my 1MB prediction. This led me to believe that regulatory elements/ promoter binding motifs must be included in the prediction interval for a more accurate prediction. But this also led me to a couple of questions:
-
Would 1MB interval prediction always be better than any smaller interval prediction, in order to include the most potential regulatory motifs? We can then narrow down the window for plotting instead of having a prediction on a shorter interval. But which prediction interval would be more “reliable", or more accurate?
-
How shall I interpret the y-axis of the graph? Is the prediction a predicted “raw count” of RNA-seq reads, or a normalised reads? If it is normalised, what would it be normalised against? Are these predictions with different intervals comparable?
Thanks so much ![]()
Best wishes,
Ken
